Stop guessing. Start understanding.
IntraLogic turns documentation, integrations, and monitoring signals into one living model of the environment — so teams see impact before it becomes downtime, and resolve incidents from context instead of guesswork.
Monitoring tells you something is down. IntraLogic tells you what it means.
By understanding dependencies, teams skip the blind troubleshooting — and stop a single failure from spreading into a wider outage.
State snapshot
Every major alert opens a diagram of the exact infrastructure state at the moment of the event.
Impact report
See which sites, roles, storage paths, and workloads are affected or at risk — at a glance.
Action context
Start from context, not a scavenger hunt across monitoring tools, diagrams, and stale docs.
One prevented outage can pay for the platform many times over.
IntraLogic isn't another diagram tool. Its value shows up as outages avoided, hours saved, and downtime that never happens.
Prevent downtime
Simulate failures before they happen and find weak dependencies before they reach production.
Save engineer hours
Cut the time spent jumping between monitoring, diagrams, tickets, and docs during an incident.
Protect revenue
Give teams a clear, evidence-backed way to justify redundancy and architecture changes.
See IntraLogic in action.
Not mockups — these are real views from the platform. Every panel below is a working part of the product today.
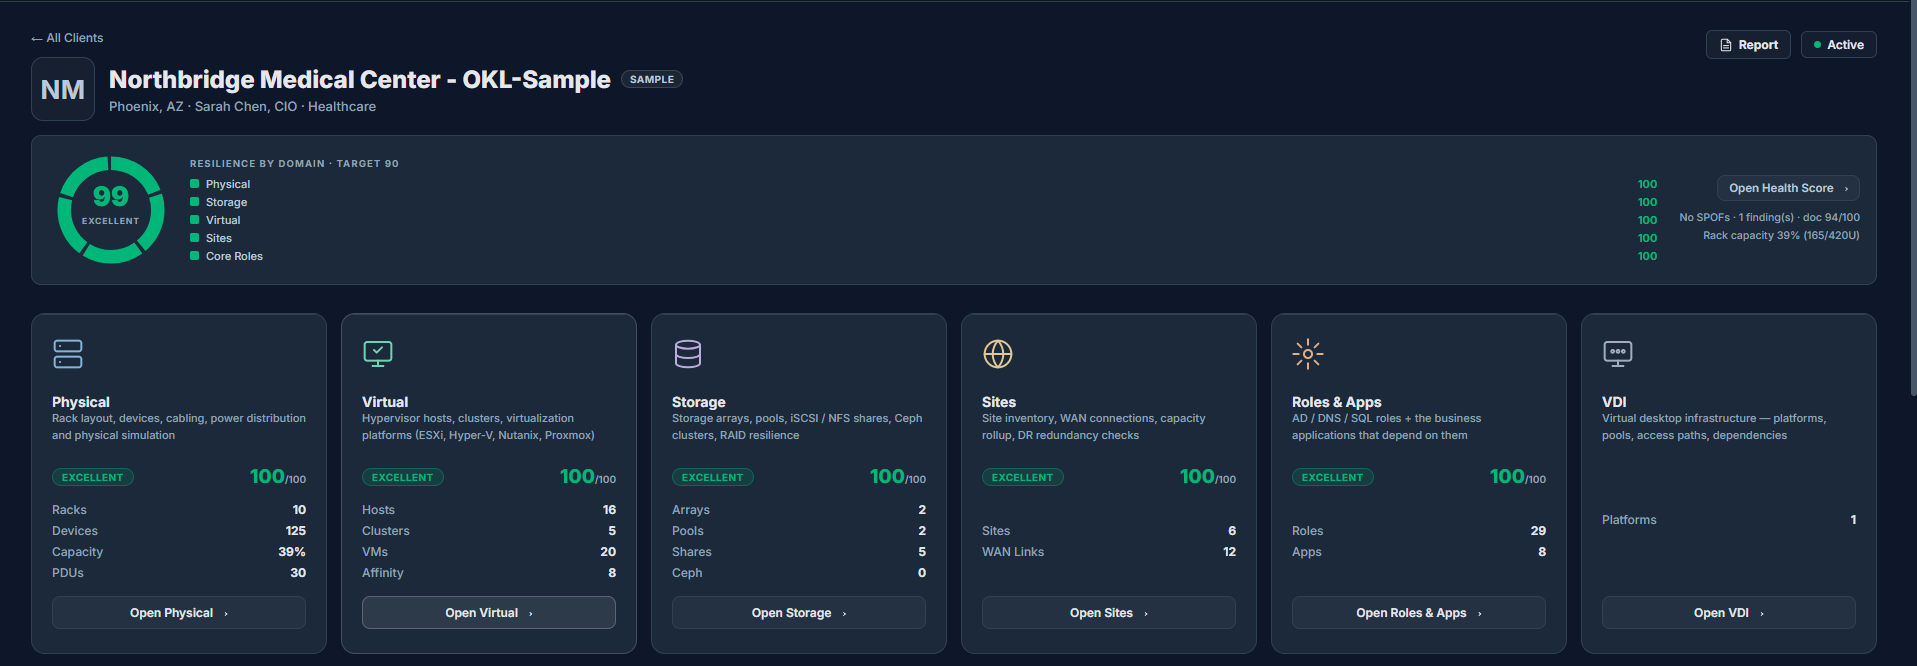
Dashboard Overview
One view across Physical, Storage, Virtual, Sites, Roles & Apps, and VDI.
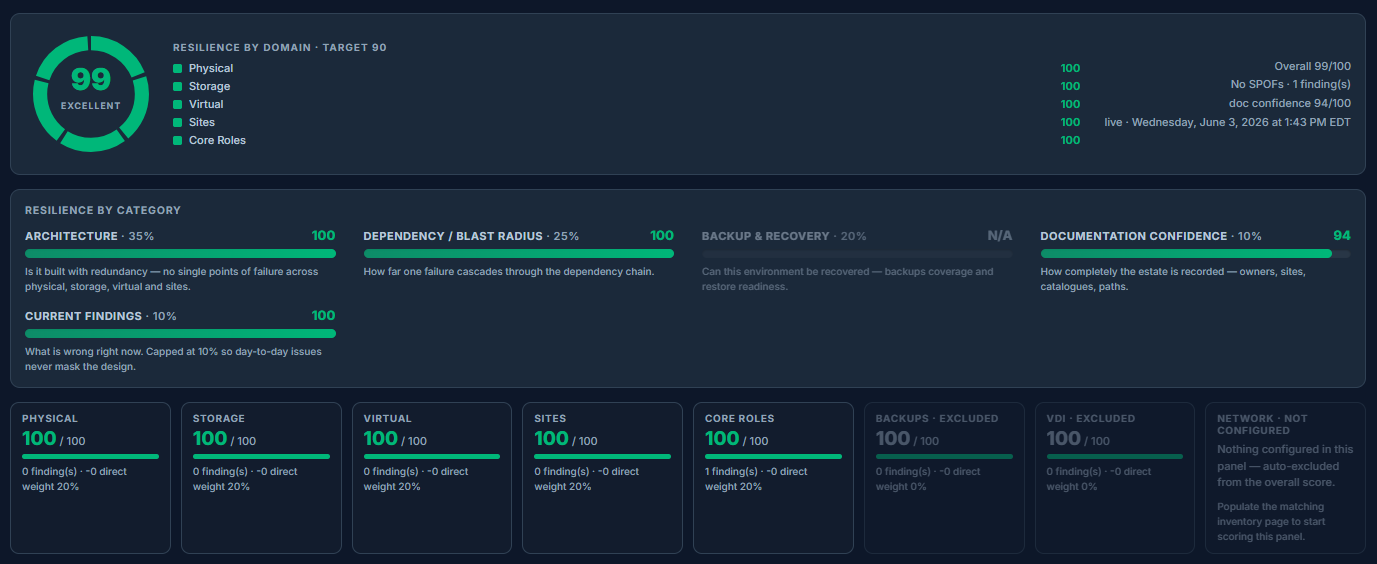
Health Scoring
Measure resilience, blast radius, architecture quality, and documentation confidence.
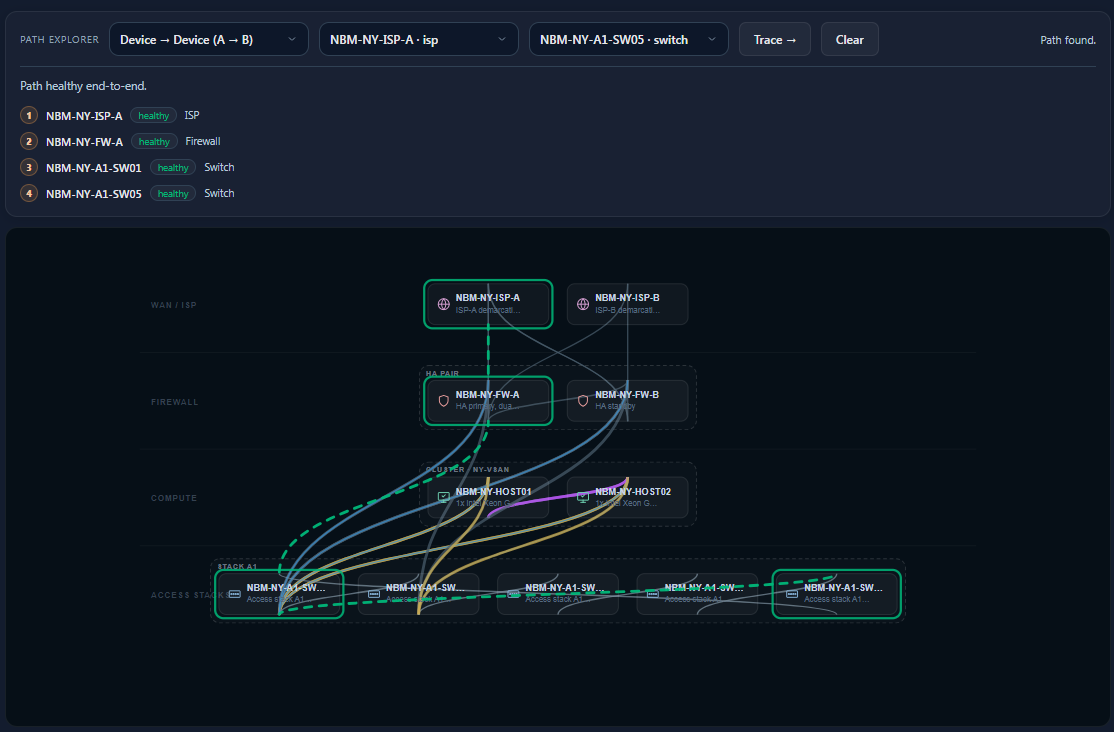
Path Tracing
Visualize exactly how traffic and dependencies flow through the environment.
Failure Simulation
Understand the operational impact before a real outage occurs.
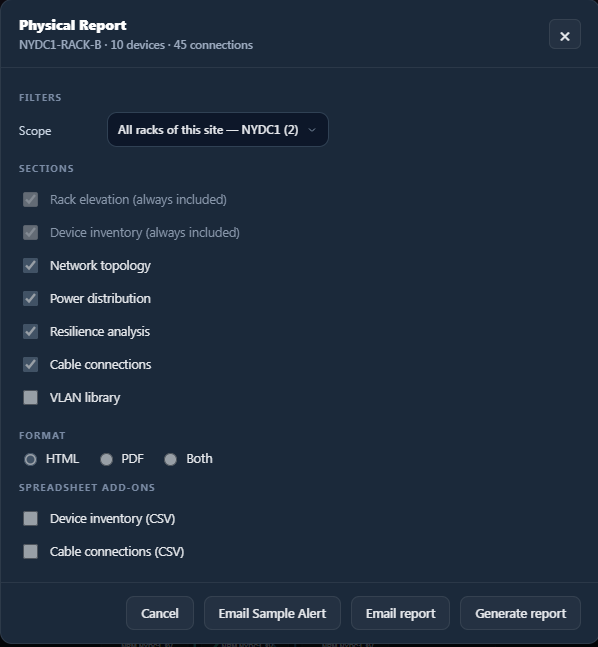
Reporting
Generate HTML, PDF, CSV, executive, and technical reports.
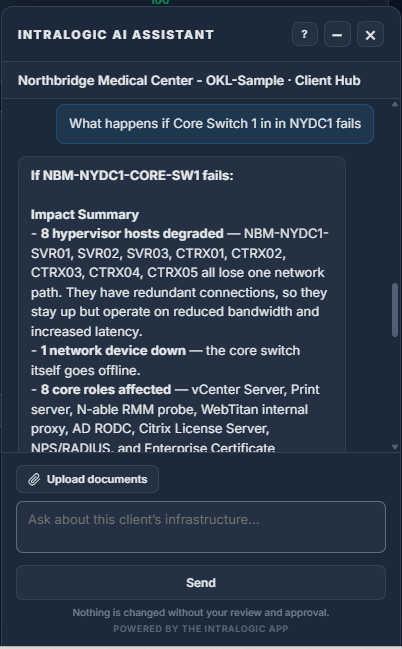
AI Assistant
Ask infrastructure questions and receive environment-aware answers.
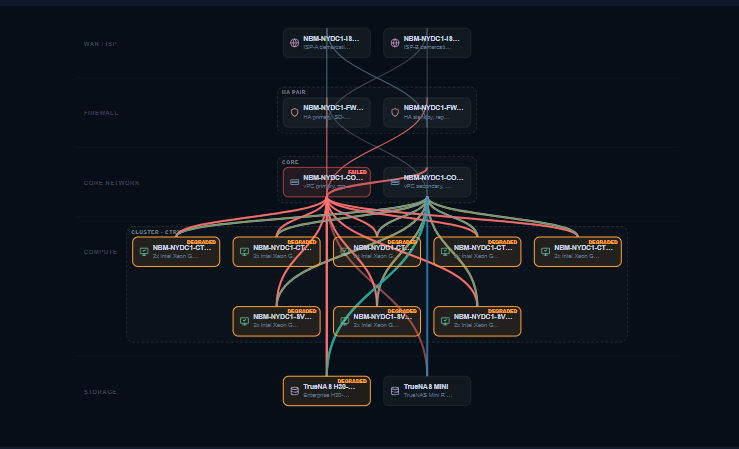
See the product thinking through a failure.
Pull one component and IntraLogic follows the dependency chain the way the environment actually would — from a single switch all the way to the applications your business runs on, then hands you the report.
A core switch goes offline in the model.
A redundant storage path drops to single-path.
Hypervisor hosts lose a network path and degrade.
VMs on those hosts inherit the reduced resilience.
Roles and business apps depending on them are flagged.
A shareable impact report captures the whole chain.
Understand the operational impact before a maintenance window, outage, or change request reaches production — not after.
Not monitoring. Not documentation. Not a diagram.
Each of those tools sees one slice. IntraLogic connects them into a model that understands dependencies, simulates failure, and explains impact across every domain.
| Capability | Monitoring tools | Documentation tools | Diagram tools | IntraLogic |
|---|---|---|---|---|
| Dependency model | — | Static | Visual only | ✓ Live model |
| Diagram creation | — | — | Manual | ✓ Automatic |
| Failure simulation | — | — | — | ✓ |
| Cross-domain analysis | Per-metric | — | — | ✓ |
| AI infrastructure assistant | — | Partial | — | ✓ |
| Health scoring | Uptime only | — | — | ✓ |
| Governance & versioning | — | Partial | — | ✓ |
| Reporting | Metrics | Static docs | Export image | ✓ Executive & technical |
Where teams reach for IntraLogic.
The same connected model answers the questions that actually come up in operations — in the incident, the planning meeting, the review, and the audit.
MSP Troubleshooting
A switch fails and the platform immediately shows the affected clients, hosts, applications, and services — so triage starts from impact, not guesswork.
Infrastructure Planning
Simulate maintenance before touching production — see what a host, path, or controller change would take down before the window opens.
Executive Reporting
Generate reports showing resilience, dependencies, and risks — in language leadership can act on, straight from the live model.
Documentation Review
Identify missing dependencies and low-confidence areas, so the gaps in the record surface before they surprise someone on call.
What changes once the environment is a model.
Reduce troubleshooting time
Start incidents from dependency context instead of a blank diagram.
Improve documentation quality
Confidence scoring exposes what’s missing or stale across the estate.
Validate redundancy
Prove there’s no single point of failure — or find the one there is.
Understand blast radius
See how far one failure cascades before it ever happens.
Improve executive visibility
Turn infrastructure risk into reports leadership can read and act on.
Support change management
Test the change in the model so surprises stay out of production.
See your environment as a connected model.
Understand dependencies, simulate failures, and make infrastructure decisions with confidence.