Every capability, in depth.
A closer look at what IntraLogic does — what each feature is, who it's built for, and the operational value it delivers. Expand any capability to read the full detail.
Consistent, version-controlled documentation and a shared model every client and engineer can trust.
Every feature reads from the same live model — so insight in one place shows up everywhere.
Keep the record consistent, current, and accountable.
Living documentation, version control, and access governance — the backbone of a trustworthy environment record.
Living, AI-generated client documentation that's produced from the live infrastructure model — not hand-maintained — and stays in step with the environment instead of going stale.
- Generate polished, client-facing documentation directly from the model with one action.
- Version-controlled history — every revision tracked, compared, and restorable.
- Narrative carry-forward keeps tone and context consistent across regenerations.
- Edit the structured details or the raw HTML; published per client under a dedicated Documentation area.
- Documentation knows when it has gone stale: a published document is fingerprinted against the model, so any later change marks it out of date and lists what moved.
The documentation engine reads the published model — sites, devices, roles, storage, virtual, and their dependencies — and writes a structured, client-ready document section by section. Because it regenerates from the model, a rack swap or a new VM appears in the next version automatically — and until you regenerate, the document is flagged out of date rather than left quietly wrong: each published version stores a fingerprint of the environment it described, so the platform can say not just that the document has drifted but which parts of it did. Every client carries that state — published, out of date, draft, or not yet generated — so nobody has to remember which client was last written up; narrative carry-forward means the hand-written context (the “why” behind a design) survives each regeneration. Every version is diffable and restorable, so you can hand a client a polished PDF/HTML pack today and prove exactly what changed since last quarter. For an MSP running dozens of clients, this turns documentation from a chore nobody owns into a repeatable, branded deliverable.
Point-in-time versions of the environment model, with side-by-side comparison across approved baselines.
- Capture published versions of the model as the environment evolves.
- Compare any two versions to see exactly what changed and when.
- Approve official baselines the whole team works from.
- Version-aware reporting and audit evidence.
A version is a frozen snapshot of the whole model at a moment in time. Publish a baseline after a review, keep working, and when you publish again you can diff the two side by side — devices added or removed, dependencies changed, resilience moved. Reports and alert snapshots are tied to the version that produced them, so an audit question like “what did this environment look like in March?” has a precise, evidence-backed answer instead of a guess.
Per-organization, per-client, and per-module controls over who sees and manages what.
- Feature governance and toggles by organization, client, and module.
- Role-aware access scoped to the right people.
- Audit trail for reviewed changes, approvals, and reports.
- Compliance-ready evidence around model and operational state.
Access is scoped on three axes — organization, client, and module — and layered with per-user permissions, so a client-facing operator, an internal engineer, and an auditor each see exactly their slice. Feature toggles turn whole modules on or off per client, and every reviewed change, approval, and generated report lands in an audit trail. For multi-tenant MSPs this is what makes “one platform, many clients” safe rather than risky.
Understand impact before it becomes downtime.
An environment-aware assistant, deterministic failure simulation, and a resilience score that turns risk into action.
An environment-aware assistant layered on top of the deterministic engine — build and explore the model in plain language. The engine stays auditable; the assistant proposes, you confirm.
- Add sites, devices, roles, storage, and VMs by describing them.
- Set up what-if tests in plain language; the deterministic engine runs them.
- Ask about dependencies, impact, and findings and get answers in context.
- Review-first — proposals stay staged until you approve them, and removing a record is permission-checked and asks for explicit confirmation.
The assistant is a translator between you and the deterministic engine — it never invents impact. Describe infrastructure in plain language and it drafts structured objects for your review; ask a what-if and it sets up the scenario the engine then simulates; ask a question and it answers from the live model using the actual dependencies. Nothing is applied silently: proposals sit in a staging state until you approve them, and the one action that removes a record is permission-checked and asks for explicit confirmation first. A junior tech can move fast without changing the record by accident.
Pull any component and IntraLogic follows the dependency chain the way the environment actually would — switch → storage → host → VM → role → application.
- Simulate device, path, or controller failures before touching production.
- See affected sites, hosts, workloads, roles, and applications instantly.
- Blast-radius view and shareable impact reports.
- Detects redundancy loss (a fabric dropping from two paths to one).
Simulation walks the real dependency graph the way a failure would cascade — a switch drops a path, the path degrades a host, the host’s VMs inherit reduced resilience, the roles and apps riding on them are flagged, and a redundant fabric falling from two paths to one is caught as a resilience loss even when nothing is fully down. The result is a blast-radius view and a shareable report you can put in front of a change-advisory board to justify a maintenance window before it ever touches production.
What a simulated failure looks like
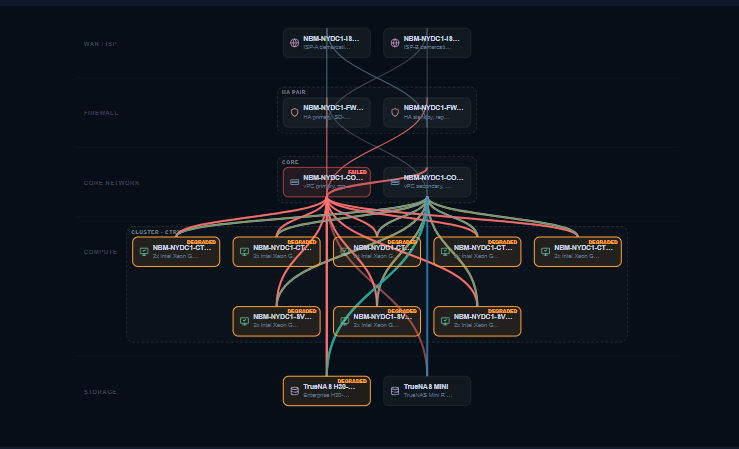
Every affected object explains itself
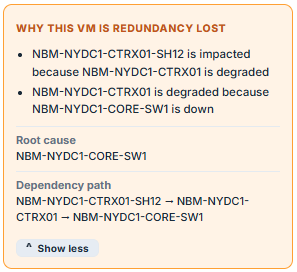
Not a colour. A chain.
Marking things red is the easy part. Ask any affected object why it is in the state it is in, and the answer comes back in the order the failure actually travelled — the session host is impacted because its host is degraded, and the host is degraded because the core switch is down — with the root cause named and the dependency path spelled out end to end.
That is the difference between an alert and an answer. Monitoring tells you the session host is unhappy. This tells you which switch to fix, what else is waiting on it, and what is merely downstream noise.
Redundancy loss, not just outage
The state in that panel is redundancy lost, and nothing is down. The workload is still serving — it has simply stopped being protected, because the second path it was relying on no longer exists. That is the state that costs people weekends: everything looks green, and the environment is one unlucky failure from an outage nobody planned for. It is reported as its own condition rather than folded into “healthy”.
A 0–100 resilience score with per-domain breakdowns, ranked findings, and recommended actions.
- Overall and per-panel scores with trend and target tracking.
- Ranked top actions and grouped findings with remediation context.
- Snapshots and simulation diffs to show before/after.
- Confidence scoring that exposes stale or missing documentation.
The score is computed from the model, not from uptime pings — it weighs redundancy, single points of failure, blast radius, architecture quality, and documentation confidence into a 0–100 number with per-domain breakdowns. Findings are ranked by impact with remediation context attached, and snapshots let you show the score move before and after a change. Leadership gets a trend line they understand; engineers get a prioritized worklist instead of a wall of alerts.
Keep documentation honest and hardware on track.
Validate the model against reality, manage the hardware lifecycle, and report on all of it.
An optional, outbound-only agent that checks your documented model against what's actually running and surfaces drift.
- Lightweight Windows agent (MSI), read-only inventory, secure outbound reporting.
- Outbound-only by design — no inbound ports and no agent-side control surface.
- Compares discovered reality against the documented model to flag drift and gaps.
- Client-scoped enrollment with credentials encrypted at rest and split agent / operational logging on short retention.
The agent is a lightweight, outbound-only Windows collector (MSI) that gathers read-only inventory and reports back over an outbound channel — no inbound ports, no remote-control surface, client-scoped enrollment, and split agent / operational logging on short retention. It compares what’s actually running against the documented model and surfaces drift — a device that appeared, a path that changed — so the record corrects itself between manual reviews.
Lifecycle tracking for every device — purchase, warranty, support, and end-of-life in one place.
- Per-device purchase, warranty, support-contract, and end-of-life dates.
- Asset dashboard with filters and CSV / PDF / HTML reports.
- Automated expiration alerts so renewals never slip.
- Lifecycle findings surfaced in the health score and dashboard widgets.
Every device can carry purchase, warranty, support-contract, and end-of-life dates, rolled up into an asset dashboard with filters and CSV / PDF / HTML exports. Expirations raise de-duplicated alerts ahead of time, and lifecycle risk feeds the health score and dashboard widgets, so aging hardware shows up as a resilience issue rather than a surprise. Walk into a QBR with a defensible refresh plan instead of a spreadsheet nobody trusts.
Enterprise reporting across every module, in the formats teams actually use.
- Export CSV, PDF, and interactive HTML from any module or the whole environment.
- Email any report on demand; client exports, site exports, and health scores can also run on a schedule.
- Consistent enterprise letterhead across inventory, dependencies, scores, and alerts.
- Per-module and combined environment reports.
One report engine spans every module, so a single action produces a consistent, enterprise-letterhead document — inventory, dependencies, health scores, alert snapshots — for one module or the whole environment, as CSV, PDF, or interactive HTML. Any report can be emailed on demand; client exports, site exports and health scores can also run on a schedule. Because they are generated from the live model, the boardroom summary and the engineer’s technical pack tell the same story without anyone rebuilding it by hand.
One connected model everything builds on.
The structure that turns raw inventory into understanding.
The connected model — Sites, Physical, Core Roles, Storage, Virtual, VDI and Backup — woven into one dependency graph with topology and rack visualization.
- Multi-site representation with per-site topology.
- Physical views: devices, racks (front / rear / 3D), paths, and cabling.
- Core roles for identity, DNS, DHCP, and applications; storage and virtual modules.
- Cross-object dependencies that drive simulation and scoring.
The seven object types — Sites, Physical, Core Roles, Storage, Virtual, VDI and Backup — are not separate diagrams; they are one connected graph where a cable, a datastore, a DNS role, and a VM all reference each other. That is what makes everything else possible: simulation can cascade across object types, the health score can reason about cross-domain risk, and a report can show the whole estate end to end. Physical adds real rack visualization (front / rear / 3D) and cabling; the graph underneath is the source of truth every other feature reads from.
Every discovered switch gets a port map — the faceplate, the real state of each port, and what is plugged into it.
- A faceplate view of every port: up and connected, down, admin-down, or bundled into a port-channel.
- Endpoints resolved from CDP/LLDP neighbours and learned-MAC evidence, so a port names the device on the other end rather than a bare MAC address.
- Port-channel and peer-link membership, including bundles that have no faceplate cell of their own.
- Per-switch VLAN, neighbour and learned-MAC counts, so you can see how much of the switch is actually understood.
- Built from agent discovery — nobody draws it, and it is re-derived on the next run.
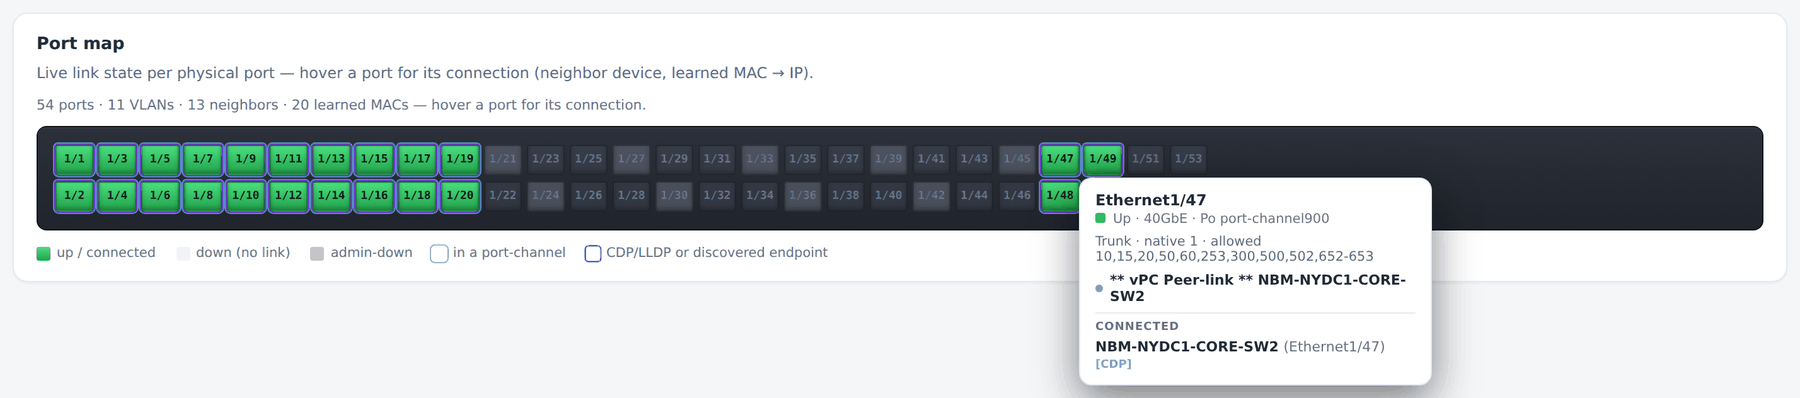
A discovered link is not a picture; it is a real edge in the same dependency graph everything else reads. So the port map is not only an inventory of what is plugged in — failing that switch in a simulation walks straight through those links to the hosts, virtual machines, roles and applications riding on them. Each link carries the evidence it was resolved from, so a neighbour learned by CDP and one inferred from a learned MAC are distinguishable rather than presented with equal confidence.
Every client is a separate environment with its own model, credentials, documentation and history — from one console.
- A client is the boundary: its model, discovery, credentials, documentation, reports and event history belong to it alone.
- Switch between clients without logging out, and see an overview across all of them or a dashboard for one.
- Discovery profiles and credentials are owned by the client, so replacing an agent does not mean re-entering them.
- Agent enrollment tokens are client-scoped.
- Access is role-aware and scoped by organization, client, and module.

Tenant isolation is enforced in the application layer — every query is scoped to the caller’s client before it reaches the data, and the same boundary governs discovery, credentials, documents, reports and the activity feed. That is the layer to ask about in a security review, and the trust centre says so plainly rather than implying isolation happens somewhere deeper than it does.
Where teams reach for IntraLogic.
The same connected model answers the questions that actually come up in operations — in the incident, the planning meeting, the review, and the audit.
MSP Troubleshooting
A switch fails and the platform immediately shows the affected clients, hosts, applications, and services — so triage starts from impact, not guesswork.
Infrastructure Planning
Simulate maintenance before touching production — see what a host, path, or controller change would take down before the window opens.
Executive Reporting
Generate reports showing resilience, dependencies, and risks — in language leadership can act on, straight from the live model.
Documentation Review
Identify missing dependencies and low-confidence areas, so the gaps in the record surface before they surprise someone on call.
See these features against your own environment.
Understand dependencies, simulate failures, and document with confidence.