Read the story, the philosophy, and the architecture behind IntraLogic — then preview the complete, role-based Documentation Center that lives inside the application. The story is fully open. The technical library is previewed here and unlocked when you sign in.
Welcome
Why this documentation exists
Everyone has monitoring. Everyone has diagrams. Everyone has documentation. Almost nobody can actually answer the question that decides every outage and every change: what depends on what, and what breaks if this fails? This is the story of a platform built to answer it — and a preview of the complete knowledge framework behind it.
Start with the story
The Story Behind IntraLogic
How years of MSP and data-center work exposed one universal blind spot.
Why IntraLogic Exists
Infrastructure outgrew the tools we use to understand it.
Real Stories
Six incidents from MSPs and internal IT that shaped the platform.
The Blueprint
The six-domain dependency model that powers everything.
Engineering Philosophy
Stop guessing. Start understanding.
How It Was Engineered
Each engine, and the question it answers.
Preview the in-app library — sign in to unlock
🔒 Preview
Physical
Racks, power, network, hosts & cabling.
🔒 Preview
Storage
Arrays, controllers, pools & paths.
🔒 Preview
Virtual
Hosts, clusters, VMs & datastores.
🔒 Preview
VDI & EUC
Desktops, session hosts, pools & brokers.
🔒 Preview
Simulation & Impact
Fail anything; see the blast radius.
🔒 Preview
AI Assistant
Ask your infrastructure, in plain language.
Section 1
The Story Behind IntraLogic
Every infrastructure has a map. Almost none have an answer.
IntraLogic didn't begin as a product. It began as a feeling — the specific, stomach-dropping silence that fills a room the moment a primary system goes dark and every face turns toward the person who's supposed to know how it all fits together.
It came out of years lived on both sides of a divide that rarely meet in the same career. On one side, managed services: running infrastructure for dozens of clients at once, each a different stack, a different vintage, a different set of undocumented decisions made by people long gone. On the other, enterprise data-center engineering: building environments from the concrete and the conduit up — power, cooling, fabric, compute, storage, the works. Two very different worlds. The exact same blind spot.
Because here's what was true in every single one of those environments, the polished enterprise ones and the scrappy SMB ones alike: they all had monitoring. They all had diagrams. They all had documentation — sometimes shelves of it, occasionally even recent. By every checklist, they were "covered."
And yet, the moment it actually mattered — a failure, a change, an audit, a hard question from the business — nobody could answer the questions that decided the outcome:
What depends on what?
What breaks if this specific thing fails?
What will Saturday's maintenance window actually take down — and for whom?
How much redundancy do we genuinely have right now — not in the design document, but as it's actually cabled and configured this afternoon?
The monitoring would announce, helpfully and loudly, that something is down. The network diagram showed how things were wired during the last refresh project — which, as everyone quietly knew, was no longer how they were wired. The documentation described the intended design, not the dozen small deviations that had accumulated since. And the real, load-bearing knowledge — the kind that lets someone say "if that switch reboots, the east cluster loses a path but stays up, and only the billing app on rack 4 is exposed" — lived in one or two senior engineers' heads. Knowledge that took a coffee, a whiteboard, and twenty minutes to extract, every time, under pressure, and that walked out the building the day those people changed jobs.
That gap — the canyon between having information and understanding the system — is where outages quietly live. It's where maintenance windows go from "routine" to "all hands on a 3 a.m. bridge call." It's where a justified upgrade dies in a budget meeting because no one could prove the risk in a language the business understood.
IntraLogic is the tool we kept wishing into existence in those rooms. Its blueprint wasn't drawn on a product whiteboard — it was written, incident by incident, over years of being the person everyone looked at when the room went quiet. This is what we built from that blueprint.
Section 2
Why IntraLogic Exists
Infrastructure outgrew the tools we use to understand it.
Somewhere along the way, infrastructure stopped being a thing you could hold in your head. It's not one system anymore — it's many systems, stacked and braided together, each depending on the layers beneath it in ways that no diagram fully captures and no single person fully remembers.
A single business application — the one the CFO calls about — might quietly depend on a virtual machine, which depends on a hypervisor host, which depends on a datastore, which is served by a storage controller, reached over a specific fabric path, through a specific switch, fed by a specific PDU, in a specific rack, at a specific site — and on a domain controller and a database role running somewhere else entirely. Pull any one of those threads and the application feels it. But nowhere in the building is that chain written down in a way that's both complete and current.
The tools we point at this complexity were, almost all of them, designed for a simpler era:
Documentation is a photograph taken the instant it's written — and out of date the instant anything changes. It describes a moment that has already passed.
Diagrams capture intent. They show how someone meant to build it. They age badly, rarely survive the second or third change, and the gap between the diagram and the rack widens silently until the day it bites.
Monitoring is genuinely excellent at exactly one job: telling you that something is down.
And "something is down" is where the easy part ends and the hard part begins. Detection is a solved problem. Understanding is not. Monitoring will light up red, but it will not tell you:
Why — the root cause versus the hundred downstream symptoms screaming at the same time.
What else — everything upstream and downstream that shares this dependency and is about to be affected.
What redundancy you just lost — whether you're now healthy-but-exposed on a single path, or genuinely one more failure from an outage.
Which business applications — the part leadership actually cares about, translated out of switch ports and into the services your users are about to lose.
So the team does what teams always do: it scrambles. Bridge calls spin up. Spreadsheets get cross-referenced. The senior engineer gets paged on their day off because they're the only one who remembers how the DR site is wired. The answer exists — it's just shattered across six tools, three out-of-date documents, and two people's memories, and it has to be reassembled by hand, under pressure, every single time.
That's the waste IntraLogic was built to end. Not to add a seventh tool to the pile — but to hold the understanding in one place, keep it true as the environment changes, and have the answer ready before the pressure starts, instead of assembling it after.
Section 3
Real Stories From MSPs & Internal IT Teams
Six moments that shaped the platform. The names are gone and the details are blended, but every one is real. If you run infrastructure for a living, you've stood in at least one of these rooms.
Story 1
The Upgrade Nobody Could Explain
The storage array was old. Not "end of support next year" old — already past its last firmware update, with two drives in a degraded pool and a controller that had thrown a transient fault twice that quarter. The senior engineer knew exactly what that meant. He'd seen it before. So he did the responsible thing: he asked for the budget to replace it.
And in the review meeting, the question came back the way it always does — "What actually happens if we wait?" He knew the answer in his gut. But in his gut isn't where budget decisions get made. He couldn't put a single slide on the screen that showed which applications rode on that array, which business processes those applications served, what the recovery time would really be if a controller dropped, or how much of the company would simply stop during the rebuild. Without that picture, his warning sounded like every other engineer asking for money for something that "might" fail. The project was deferred to next quarter. Then the one after.
The controller failed on a Tuesday. Not gracefully — it took a pool with it, and with the pool went the datastores, and with the datastores went a tier of VMs that, it turned out, several departments depended on far more than anyone had mapped. The replacement happened anyway. It just happened as a frantic emergency purchase at list price, with overnight shipping, a 19-hour restore, and a postmortem where the same engineer got to say "I asked for this in March" to a room full of people who finally believed him.
IntraLogic was built so that engineer walks into the first meeting with the picture already drawn — every application and business service that depends on that array, the redundancy it has and doesn't, and exactly what a failure cascades into — so a justified upgrade gets approved on evidence instead of approved on regret.
Story 2
The Maintenance Window Fear
It was supposed to be a fifteen-minute job: push a firmware patch to a core switch and reboot it. Routine. The kind of thing that lives on a Tuesday-night change calendar without a second thought.
Except nobody could answer the questions that turn "routine" into "risky." When that switch goes down for its reboot — what goes with it? Which hosts lose a path, and which lose their only path? Which VMs sit on those hosts right now, after eighteen months of vMotions nobody fully tracked? Which applications live on those VMs? Does the second site stay reachable, or does that switch quietly carry a link nobody remembers provisioning? And while it's down — for those fifteen minutes — is the environment merely degraded, or sitting one unlucky failure away from a real outage?
Nobody knew. Not with confidence. So the fifteen-minute job grew. It grew a window padded to two hours "just in case." It grew a rollback plan, a second engineer on standby, a heads-up email to three department heads, and a low, persistent dread the team had simply learned to live with. The change probably would have been fine. But "probably" is an expensive way to run infrastructure, and fear is a tax you pay on every single change.
IntraLogic was built to replace that dread with a picture. Before touching anything, the engineer marks that switch as failed in a simulation and watches the blast radius light up across every domain — these hosts lose redundancy, these two VMs lose their last path, this application is exposed, the DR link survives, and here's exactly how much margin is left while the work happens.
Story 3
The Mystery Outage
A storage-fabric switch failed at 4:40 in the afternoon, and the monitoring platform did its job beautifully — which is to say it generated three hundred alerts in ninety seconds. Hosts losing paths. Datastores going read-only. VMs heartbeat-timing-out. Applications throwing connection errors. The alert channel became a waterfall nobody could read.
And that was the problem. Detection was instant. Understanding took the rest of the evening. The team didn't spend the night fixing the switch — that part was twenty minutes. They spent it doing forensic triage on their own environment: which of these three hundred alerts is the cause and which are symptoms? What actually went down versus what's just complaining about something upstream? Which screaming application matters to the business tonight, and which can wait until morning? They reconstructed the dependency chain by hand, in a war room, from memory and guesswork, while the business asked for updates every fifteen minutes.
By the time they had a clear answer — one switch, these two paths, this set of VMs, this one customer-facing app genuinely down and everything else merely noisy — they could have had it in the first ninety seconds, if anything had been holding the map.
IntraLogic was built to collapse that night into a glance. The instant a component fails, it shows what failed, what survived, what's degraded but serving, which applications are actually impacted, and what to fix first — so the team spends its energy resolving the incident instead of decoding it.
Story 4
The MSP Looking For Something Better
This MSP had done everything right. RMM. Monitoring with dashboards on the wall. A documentation platform their clients paid for. Network diagrams, asset spreadsheets, runbooks, the lot. On paper, they were the mature shop — the one that took it seriously.
And yet every meaningful incident still played out the same way. A ticket comes in: "the practice-management app is slow at the Riverside clinic." And the response — even with all those tools — was phone calls. Which client is Riverside again? Who set up their environment? Is that the site with the two-node cluster or the three? Did their database move to the new host last spring? The information was technically somewhere. But it was scattered, none of it cross-referenced, and reassembling it took the most expensive thing the MSP had: senior engineer attention, on the phone, mid-incident, across forty client environments that all blurred together.
They didn't want a seventh tool to log into — they were drowning in tools. What they wanted was almost philosophical: one source of truth per client, and an AI that actually understood that specific client's infrastructure. Not a generic chatbot that gives the textbook answer about RAID. An assistant that knew this client had these arrays, those clusters, this application that depends on that role — and could answer the way the senior engineer would, if the senior engineer were available, which they never were.
That conversation became one of the inspirations behind IntraLogic AI: an assistant grounded in the tenant's own modeled environment, answering from the real dependency graph instead of guessing from a prompt — so knowledge that used to require a phone call to one specific person is available to the whole team, per client, on demand.
Story 5
New Employee Onboarding
The new engineer was good. Sharp, experienced, hired specifically because the team was stretched. On her first day she got the standard welcome kit: a folder of Visio diagrams, a documentation wiki, and a couple of spreadsheets that "mostly" tracked the environment.
None of it matched reality. The diagrams showed a storage layout re-architected the previous year. The wiki described a backup scheme that had since changed vendors. The spreadsheet's "primary DNS" was a server that had been decommissioned. None of it was wrong on purpose — it was just the natural entropy of documentation that depends on busy humans to maintain it. Every artifact was a snapshot of a moment that had already passed.
So she did what every new engineer does: she rebuilt the real picture in her own head, slowly, by asking. By tracing a cable. By breaking something small and watching what complained. It took the better part of three months before she could be trusted to make a change without a babysitter — three months of a senior engineer's time spent re-explaining an environment that already existed, just nowhere she could actually use it.
IntraLogic was built to make day one look like month six. Because the model is a living twin that reflects reality and stays current, onboarding stops being archaeology — the new engineer opens the platform and sees the environment as it actually is, instead of reconstructing it one conversation at a time.
Story 6
Planning Without Seeing Dependencies
The roadmap was full of perfectly reasonable projects. Migrate the file servers to new hardware. Re-IP a subnet. Consolidate two storage pools. Retire an old hypervisor host. Each one, on its own, was a clean, well-understood task with a tidy change plan.
And each one was quietly terrifying, because no one could see across the seams. The host being retired — was anything else pinned to it by an affinity rule nobody remembered writing? The subnet being re-IP'd — did some application have a hard-coded dependency on an address in it? The pools being consolidated — which datastores, which VMs, which apps, which sites touched them? The risk in every project didn't live inside the project. It lived in the cross-domain dependencies — the threads that tie a storage change to a virtualization outcome to an application impact — and those were exactly the threads no tool made visible. "Change" had become the most feared word on the roadmap.
IntraLogic was created to make infrastructure understandable before the change is made. Model it, see the dependencies, simulate the change, read the blast radius — and walk into the maintenance window informed instead of brave.
Section 4
The Blueprint
Infrastructure isn't a set of lists. It's a dependency graph — and that one shift changes everything.
Look closely at the six stories and they all collapse into a single root cause. We manage infrastructure as separate inventories: a list of servers here, a list of switches there, a spreadsheet of VMs, a register of applications. Each list is tidy. Each list is even accurate. And the list format hides the one thing that decides what happens when something fails — the relationships between the items.
A list of switches can't tell you that this switch is the last path to that datastore. A list of VMs can't tell you that three of them share a host fed by a single PDU. A list of applications can't tell you that the one everyone cares about leans on a domain controller two racks and one site away. The information you most need in a crisis is precisely the information the inventory model throws away.
So IntraLogic models infrastructure the way it actually behaves — as six connected domains:
DOMAIN 1
Physical
Racks, power, network, hosts, and the cabling that physically ties them together. The foundation everything stands on.
DOMAIN 2
Storage
Arrays, controllers, pools, vdevs, volumes, and the fabric paths that serve them. Where the data actually lives.
DOMAIN 3
Virtual
Hypervisor hosts, clusters, virtual machines, and the datastores they run on. Where the workloads actually run.
DOMAIN 4
VDI & End-User Computing
Virtual desktops, session hosts, desktop pools, brokers, and the profile/FSLogix storage they ride on. Where the workforce actually connects.
DOMAIN 5
Applications & Roles
The business applications people use, and the core roles — DNS, Active Directory, databases, brokers, file services — they quietly stand on. Where infrastructure becomes business.
DOMAIN 6
Sites & Resiliency
Physical locations, WAN links, HA pairs, and cross-site failover. Where "what if the building floods" finally gets an answer.
But the six domains aren't the point. The point is the edges between them — the dependencies. That's where the understanding lives. A failed PDU isn't a power event that stays in the power domain; it's the first link in a chain that can travel to a switch, to a host, to a cluster, to a VM (or a pool of virtual desktops), to a core role, and finally to the application a user is staring at — crossing every domain in a single failure. Model the components and the edges, and the question that used to require a war room — "what breaks if this fails?" — stops being a meeting and becomes a query the platform answers in real time.
That's the blueprint: not a prettier inventory, but a live dependency graph of the whole environment, end to end.
Section 5
The Engineering Philosophy
Stop guessing. Start understanding.
Every category of tool the industry already had was, on its own, both necessary and insufficient. Not wrong — incomplete. Each one solved a real problem and left a specific, dangerous blind spot:
Monitoring alone tells you something broke. It does not tell you what it means — and meaning is the entire job during an incident.
Documentation alone is correct for exactly as long as nothing changes, which in real infrastructure is approximately never. It describes the past and is trusted as the present.
Diagrams alone show intent — how someone meant to build it — not the live truth of how it's wired and configured today.
AI alone is fluent, fast, and confidently wrong, because it doesn't know your environment. Generic intelligence applied to a specific infrastructure is just an articulate guess.
The mistake the industry made was treating these as competitors — as if the answer were "better monitoring" or "AI instead of all of it." It isn't. Understanding doesn't come from winning that argument. It comes from combining these capabilities into a single system where each one covers the others' blind spots:
Modeling captures what you actually have.
Dependencies capture how it's all connected.
Simulation turns "what if" from a debate into a visible, testable blast radius.
Resilience rules turn hard-won operational experience into findings that surface automatically, before someone gets paged.
Living documentation keeps the entire picture true as the environment changes, so it never decays into another stale artifact.
AI grounded in real infrastructure data turns all of the above into answers in plain language — for the engineer, the new hire, and the executive alike.
That combination — not any single feature — is the philosophy. IntraLogic is deliberately opinionated about exactly one thing: an engineer should be able to understand their infrastructure, not merely observe it.
Section 6
How IntraLogic Was Engineered
Every system in IntraLogic was built backwards from a real incident — each exists to answer a question the old tools couldn't.
Live Infrastructure Twin
A working model that reflects reality and stays current as the environment changes, so it never decays into another stale diagram or out-of-date wiki page. Answers: "Does our documentation actually match what's running?" — and the answer stays yes.
Cross-Domain Dependency Engine
The graph that connects all six domains and lets impact travel along the edges, from a single cable all the way to a business application. This is the spine the entire platform stands on. Answers: "What depends on this — really, end to end?"
Resilience Engine
Encodes how redundancy and high availability are supposed to work and continuously checks the live model against those expectations, so "we have redundancy" becomes a verified fact instead of an assumption. Answers: "Do we actually have the redundancy we think we have — right now?"
Findings Engine
Surfaces risks and weaknesses and, crucially, explains them in plain terms. It understands that ten alarming symptoms are often one underlying problem, so it points at the root cause instead of drowning you in noise. Answers: "What's wrong, and what's the real problem behind it?"
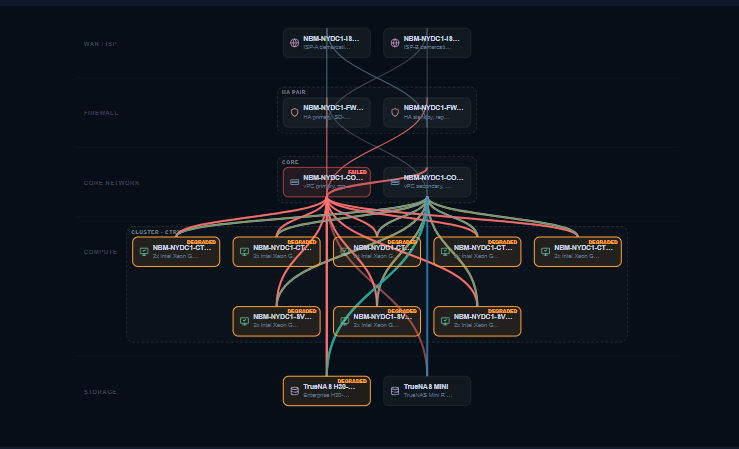
Simulation & Impact Engine
Fail anything you like, on purpose, in a safe model: a disk, a switch, a controller, a PDU, an entire site. Watch the blast radius propagate across every domain before any of it is real. Answers: "What breaks if this goes down — and how much margin is left while it's down?"
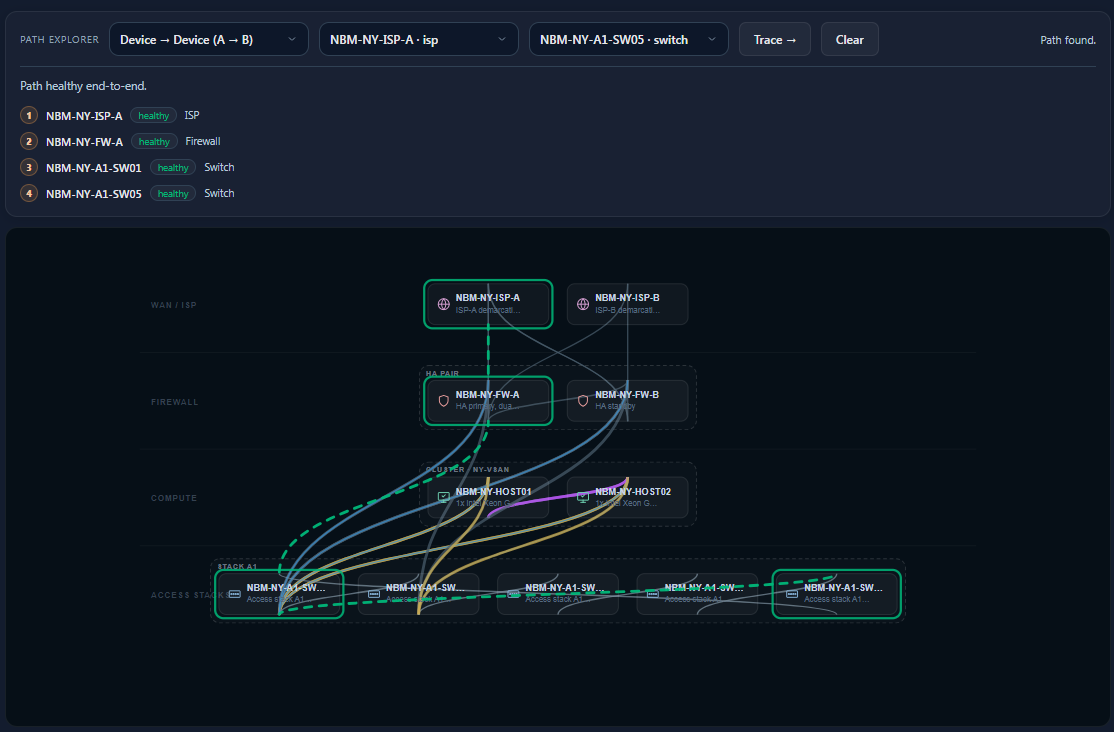
Path Tracing
Follows the actual route a workload takes through the environment: VM to datastore to controller to fabric to switch to power, hop by hop, as it's genuinely configured. Answers: "How is this really reaching its storage and its network?"
Living Documentation
Documentation generated from the live model, so it's accurate by construction rather than by discipline. The hardest question in documentation — "who's going to keep it updated?" — is answered by the platform itself. Answers: "Will the docs still be true in six months?"
AI Grounded in Tenant Data
An assistant that reasons over your modeled environment and its dependency graph, not a generic model improvising from a prompt. It gives the answer the senior engineer would give about this infrastructure — to anyone on the team, on demand. Answers: "Can I just ask the system about itself?"
Enterprise Foundations
None of the above is safe to run for real clients without the unglamorous parts done right: strict multi-tenancy and tenant isolation, role-based access control, versioning of the model over time, reports and exports that are scoped and shareable, and architecture diagrams generated from the truth.
Every one of these systems traces back to a night, a meeting, or an outage where the old tools left someone guessing. Put together, they're the answer to the question that started it all — the one monitoring could never answer: not just what's down. What it means.
🔒 Preview
Getting Started
Your first hour in IntraLogic: signing in, the five-minute quick start, and the build order that takes you from an empty tenant to a complete, resilience-scored model — site → physical → storage → virtual → roles → apps.
How to think in IntraLogic: the live twin, completeness pills that show how trustworthy each part of the model is, and the Live / Simulate / Edit mode that frames everything you do.
6 Articles22 ScreenshotsConcept Diagrams
The live twinDependencies
🔒 Preview
Physical
Racks, power feeds (PDU / UPS / utility), network switches and stacks, hosts, and full front/rear/3D rack visualization with drag-and-drop cabling — the foundation the whole dependency graph stands on.
Arrays, dual/single controllers, pools, vdevs, volumes/LUNs, and MPIO path modeling — with an enterprise chassis view, controller-to-switch path derivation, and capacity findings that catch over-allocation before it bites.
Hypervisor hosts, clusters and HA pairs, virtual machines, datastores, and affinity rules — with per-host capacity, cluster resilience checks, and cross-domain impact when an upstream switch or array fails.
Virtual desktop platforms (Citrix, Horizon, AVD), session hosts, desktop pools, connection brokers, and the profile/FSLogix storage they depend on — modeled as a first-class domain so end-user impact is visible when something upstream fails.
9 Articles40 ScreenshotsBroker / Pool DiagramsSimulation Examples
Desktop poolsBroker failure
🔒 Preview
Applications & Roles
Business applications and the core roles — DNS, Active Directory, databases, brokers, file services — they quietly depend on. This is where infrastructure becomes business impact, and where "what does the user lose?" gets an answer.
Physical locations, WAN links, cross-site HA and DR, and per-site resilience scoring — so multi-site failover is something you can see and test, not something you hope works.
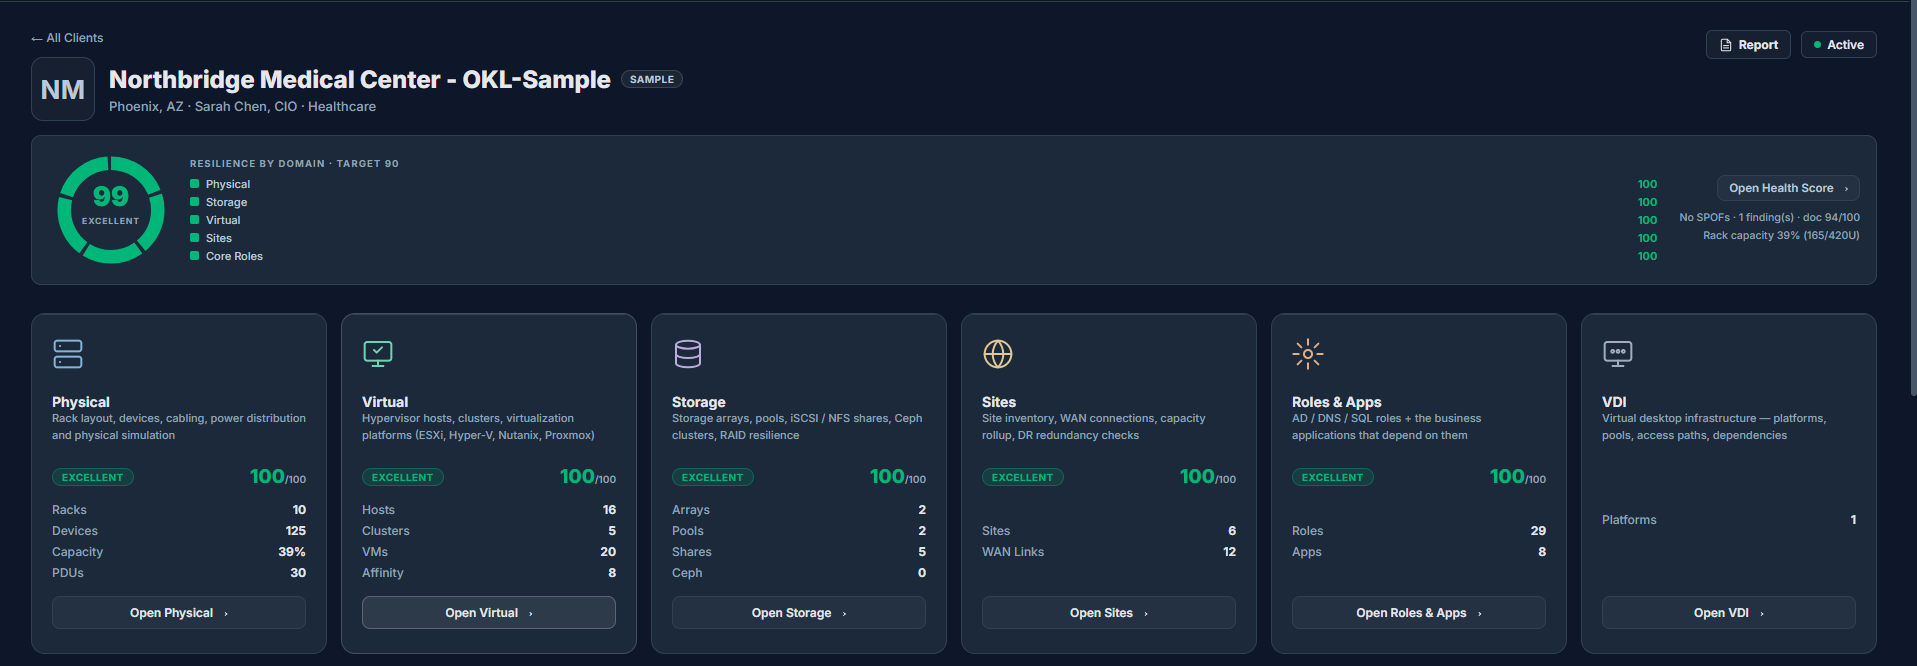
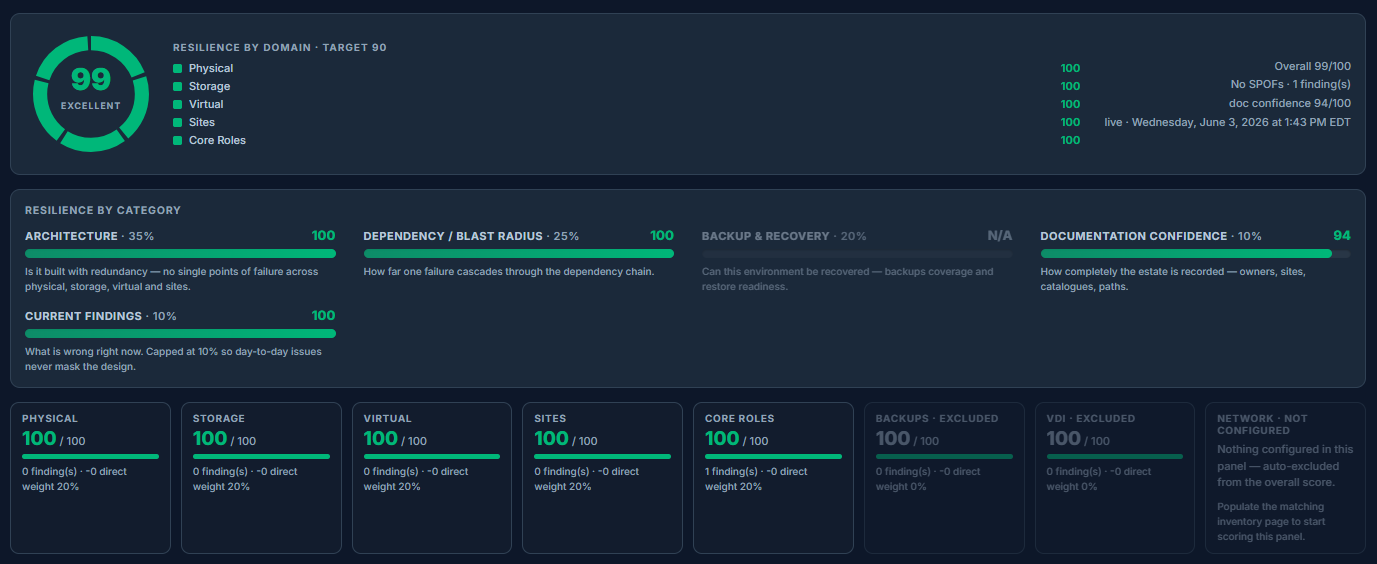
The 0–100 resilience number — what drives it, how each domain contributes, how it trends over time, and how it maps to the findings you should act on first.
6 Articles30 ScreenshotsScoring Breakdown
Score dashboardTrend & drivers
🔒 Preview
Findings
What the resilience engine flags and why, how ten symptoms can be "one" root cause, severity and tier escalation, and how to disposition or dismiss a finding with a documented reason.
7 Articles34 ScreenshotsRule CatalogExamples
Findings listRoot-cause view
🔒 Preview
Simulation & Impact
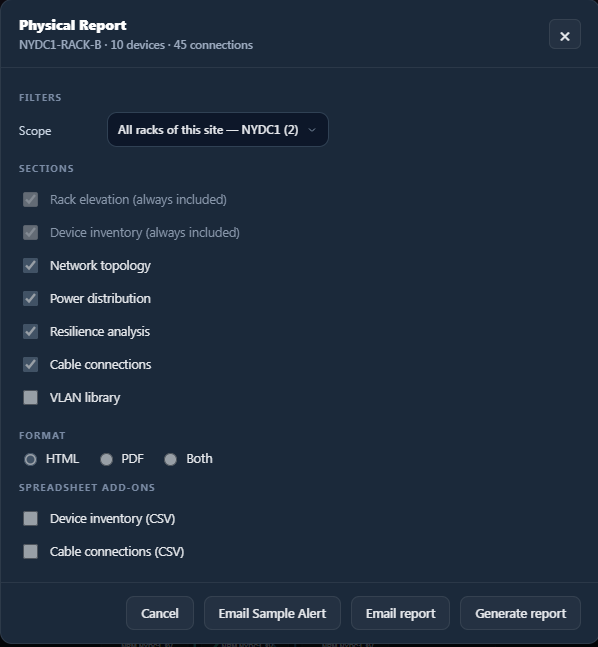
Fail a disk, switch, controller, PDU, host, or whole site — and watch the blast radius propagate across every domain. Includes impact reports, emailable alerts, and the remaining-redundancy view for maintenance planning.
Scoped, branded HTML and PDF reports — per client, per site, per panel — that you can schedule and email. Built so an engineer can hand leadership a picture instead of a hunch.
5 Articles24 ScreenshotsReport Templates
Report exportScored summary
🔒 Preview
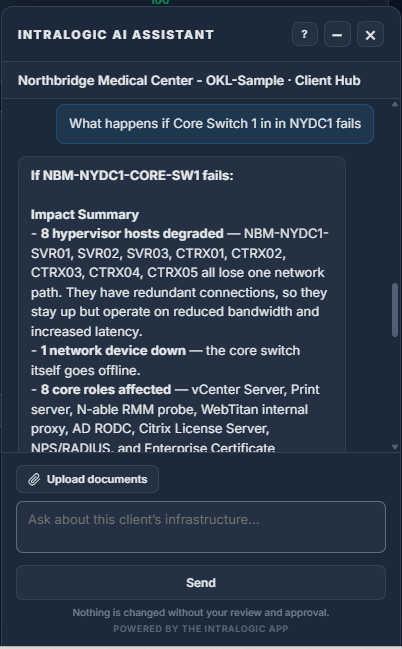
AI Assistant
Ask about your infrastructure in plain language — grounded in your modeled environment and its dependency graph, not a generic model guessing from a prompt. Scoped by tenant and permission, with read and confirmed-write capabilities.
6 Articles28 ScreenshotsPrompt Examples
AI assistantGrounded context
🔒 Preview
Administration
Users and roles, client & MSP management, SMTP, audit logs, app & AI usage analytics, log retention, and the feature toggles that govern what each tenant and user can see.
11 Articles52 ScreenshotsAdmin Workflows
Admin consoleUsage & audit
🔒 Preview
Living Documentation
AI-generated, version-controlled client documentation produced from the live model — so the record stays true as the environment changes, with narrative carry-forward and a full version history.
4 Articles20 ScreenshotsVersion History
Generated docsVersioned record
🔒 Preview
Security & Access
MFA, strict multi-tenant isolation, role-based access control, invite-only users, and per-feature gating — the foundations that make IntraLogic safe to run for real client environments at scale.
6 Articles26 ScreenshotsAccess Model
Access & roles
🔒 Preview
Versions & History
How IntraLogic versions the infrastructure model over time, compares snapshots, and lets you see what changed between two points — turning "what did we change last quarter?" into a query.
4 Articles18 ScreenshotsCompare View
Snapshot compare
🔒 Preview
Release Notes
What's new in IntraLogic — features, fixes, and platform improvements, documented inside the application as they ship.
Updated ContinuouslyIn-app Changelog
In-app changelog
You've seen why IntraLogic exists.
Experience how it works inside the application — with the complete, role-based documentation, your real model, and the full dependency engine.