Real views from a working platform.
These are actual screenshots from IntraLogic — the central hub, failure simulation, path tracing, the AI assistant, reporting, and health scoring. Explore what the product does today, then log in if you already have access.
Every image below is a real screen from IntraLogic, not a mockup.
See a failure ripple across dependencies and end as a shareable report.
Six places the product proves itself.
Jump to any example below.
Central Hub
The product entry point — full environment overview and module launcher.
Failure Simulation
Pull a component and watch the blast radius spread across the topology.
Path Trace
Follow a route hop-by-hop and see the health of every device along it.
AI Assistant
Ask infrastructure questions and get environment-aware answers.
Report Export
Generate HTML, PDF, CSV, executive, and technical reports.
Health Score
Resilience, blast radius, architecture quality, and documentation confidence.
One view across the whole environment.
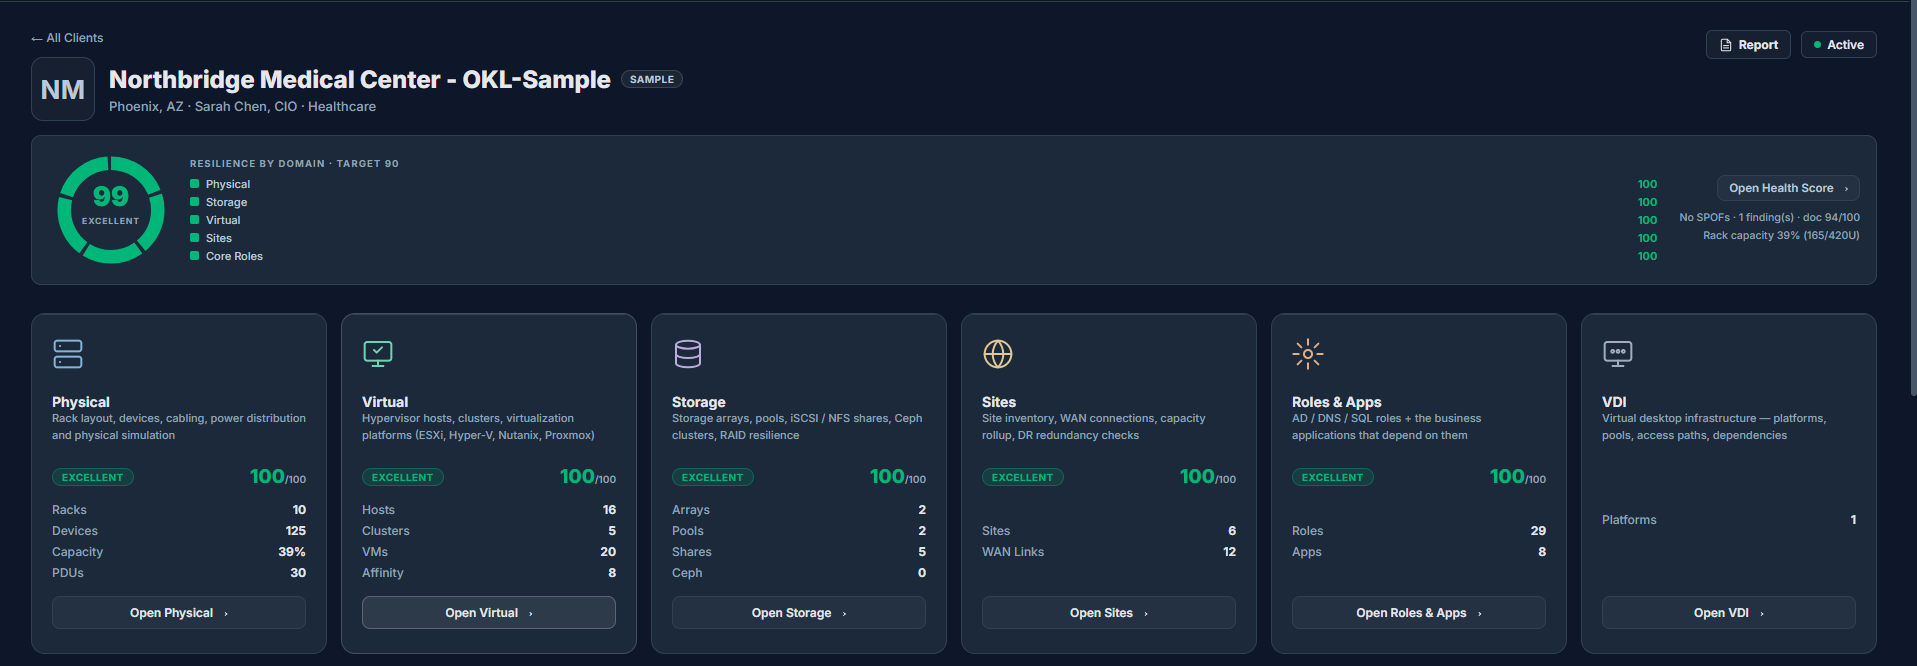
The client hub opens on a single resilience score and a card for every domain — Physical, Virtual, Storage, Sites, Roles & Apps, and VDI — each with its own score and live counts. Drill into any one to work the detail, or stay up top for the whole-of-environment picture.
- ✓Overall resilience donut with target and per-domain breakdown
- ✓Live inventory counts — racks, hosts, clusters, VMs, arrays, pools, sites, roles, apps
- ✓One click into each module, or straight to the Health Score
One screen replaces a scavenger hunt across monitoring, diagrams, and docs — everyone works from the same picture of the environment.
Understand the blast radius before it happens.
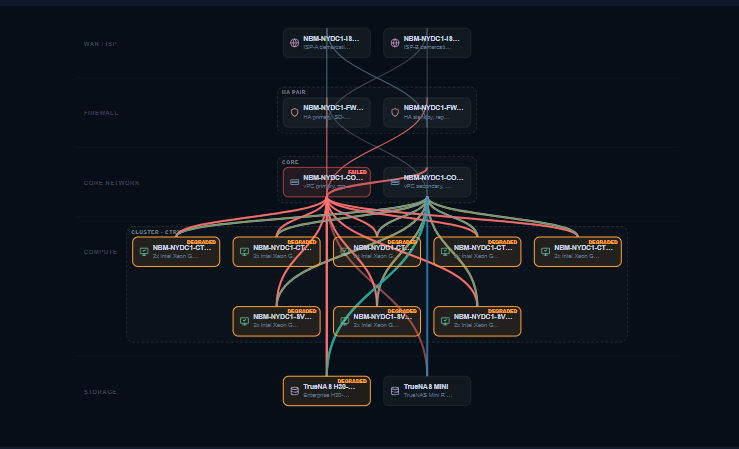
This is one of IntraLogic’s primary differentiators. Fail a component in the model and the platform traces the consequence the way the real environment would — layer by layer — so you see the operational impact before a real outage forces you to.
- ✓Core switch failure — one core device is taken offline in the model.
- ✓Host degradation — hypervisor hosts lose a path and drop to reduced redundancy.
- ✓Application impact — the roles and business apps riding on those hosts are flagged.
- ✓Service degradation — storage paths and dependent services show their degraded state.
- ✓Operational report — the full chain is captured in a report you can share.
Understand the operational impact before a maintenance window, outage, or change request reaches production — not after.
See exactly how traffic and dependencies flow.
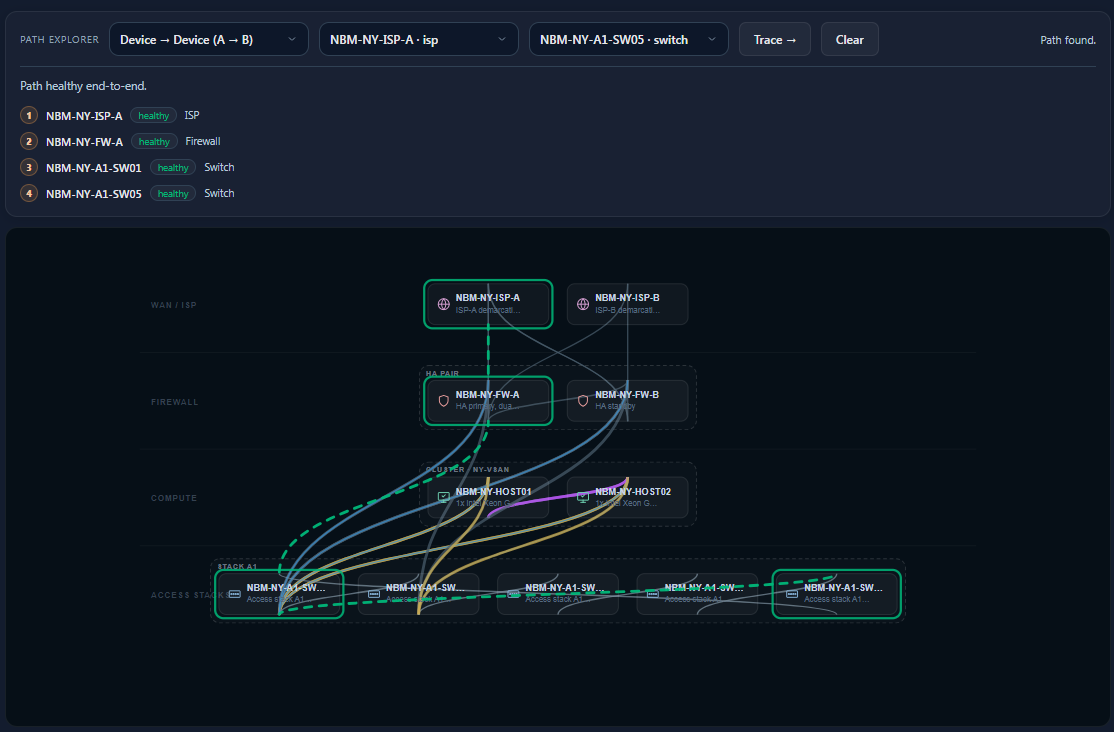
Pick a start and an end — device to device, or across the environment — and IntraLogic resolves the actual path, hop by hop, against the live model. Each hop shows its type and health, and the route lights up on the topology so there’s no guessing where a dependency runs.
- ✓End-to-end route across ISP, firewall, switching, and compute
- ✓Per-hop health so a weak link is obvious at a glance
- ✓The path highlighted directly on the environment diagram
When something breaks, prove exactly which path a service depends on instead of guessing where traffic actually flows.
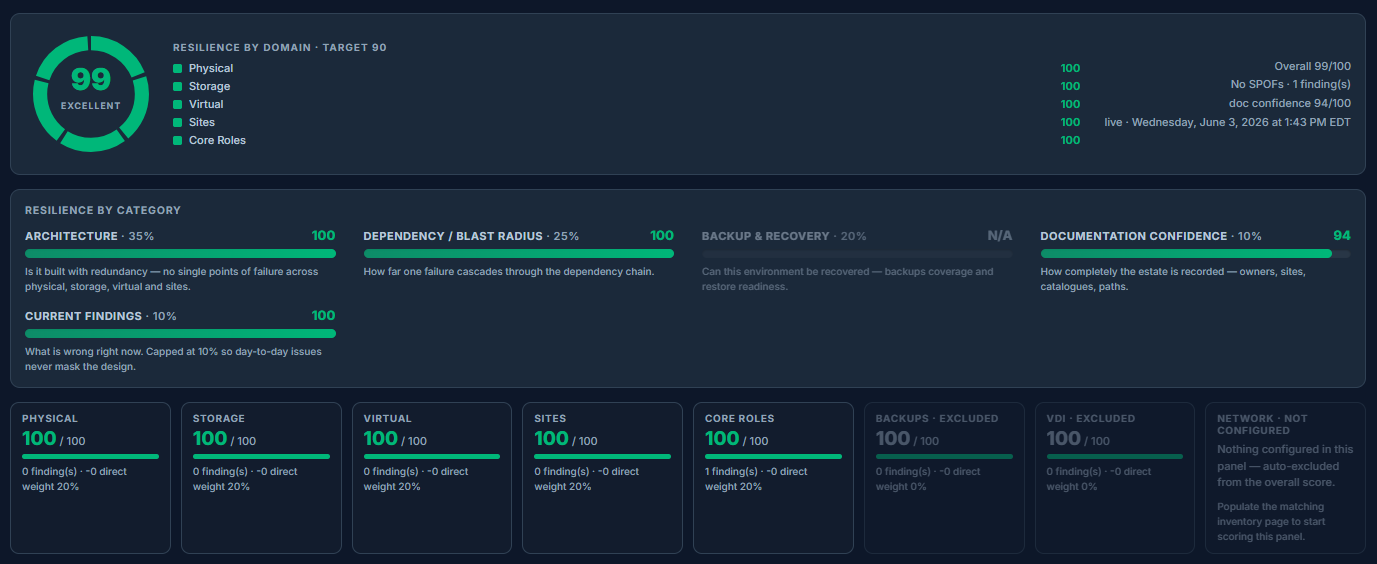
Operational readiness — not only uptime.
A green monitoring dashboard tells you things are up right now. IntraLogic scores whether the environment is actually built to survive a failure, and how well it’s documented.
- ✓Resilience score — is it built with redundancy, with no single points of failure?
- ✓Dependency / blast radius — how far does one failure cascade?
- ✓Architecture quality — how sound is the design across every domain?
- ✓Documentation confidence — how completely is the estate actually recorded?
A green uptime board can still hide a single point of failure — readiness scoring tells you whether the design will actually survive one.
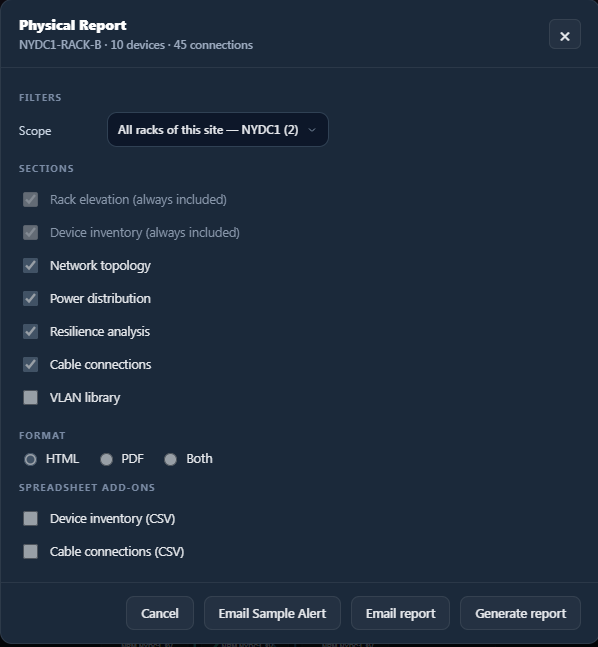
Board-ready and engineer-ready, from the same model.
Choose a scope, pick the sections, and export. The same engine produces a clean executive summary or a detailed technical record — in the format the audience needs.
- ✓HTML reports for sharing and review
- ✓PDF reports for board-ready output
- ✓CSV exports for inventory and cabling
- ✓Scheduled email reports
- ✓Executive and technical report depth
The same model serves the boardroom and the on-call engineer — nobody has to rebuild the story by hand for each audience.
Ask the environment a question.
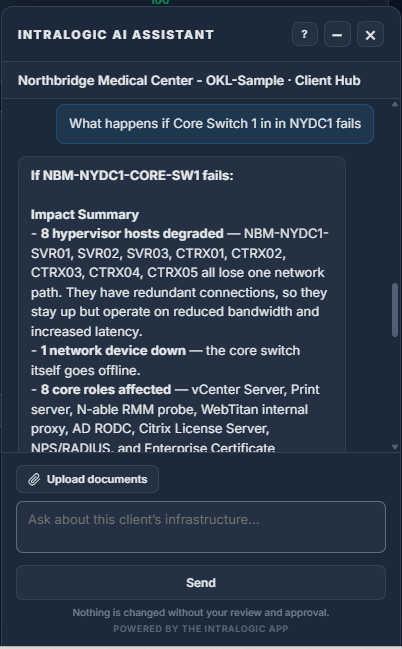
The AI assistant is built on top of the IntraLogic model. The deterministic engine performs the actual dependency analysis — AI is how you talk to it in plain language. Nothing changes without your review and approval.
The assistant helps users:
- ✓Ask questions about the live environment
- ✓Build and extend the model
- ✓Review infrastructure and spot weak points
- ✓Understand impact before a change
- ✓Generate reports
Anyone on the team can interrogate the environment in plain language — without first knowing where every dependency is documented.
- What happens if Core Switch 01 fails?
- Which applications depend on Datastore 3?
- Which clients have single-path storage risk?
- Generate an executive report for this site.
Answers are grounded in the model the engine actually analyzes, not a guess:
- ✓Based on the actual infrastructure model
- ✓Uses documented dependencies
- ✓Uses simulation rules
- ✓Uses published environment data
- ✓Review-first workflow